Badanie – Specjaliści UX 2015

Po raz trzeci, razem z Joanną Kwiatkowską i (premierowo) Michałem Aleksandrem przygotowaliśmy pytania, które będą podstawą do opracowania Profilu specjalisty User Experience w Polsce 2015.

Ankieta zawiera 31 pytań, a jej wypełnienie zajmuje około 15 minut. Udzielenie odpowiedzi na wszystkie postawione przez nas pytania jest nieobowiązkowe, dlatego pytania mozna po prostu pominąć. Adres do ankiety:

badanie.hci.org.pl

https://www.surveygizmo.com/s3/2126319/d05c5b7e1c5f

Badanie jest realizowane w okresie od 18 do 30 maja 2015 r. Po wypełnieniu ankiety zachęcamy do pozostawienia adresu e-mail, na który prześlemy raport podsumowujący badanie. Adres e-maill nie jest powiązany z udzielanymi odpowiedziami.
Bardzo gorąco zapraszamy do udziału ;)

Wyjaśnienie: nawał zawodowych obowiązków, uniemożliwił nam publikację pełnych wyników z roku 2013 roku. Najważniejsze wnioski, zostały ogłoszone na WUD na Pradze 2013 i są od tego czasu dostępne w serwisie SlideShare. Aby nie doszło do podobnej sytuacji także w tym roku, poszerzyliśmy zespół autorów o Michała. 
Wyrwane z kontekstu – Searching for Explanations

Searching for answers online leads to an illusion such that externally accessible information is conflated with knowledge “in the head”. This holds true even when controlling for time, content, and search autonomy during the task . Furthermore, participants who used the Internet to access explanations expected to have increased brain activity, corresponding to higher quality explanations, while answering unrelated questions . This effect is not driven by a misinterpretation of the dependent measure  or general overconfidence and is driven by querying Internet search engines. (…)

 After using Google to retrieve answers to questions, people seem to believe they came up with these answers on their own; they show an increase in “cognitive self-esteem,” a measure of confidence in one’s own ability to think about and remember information, and predict higher performance on a subsequent trivia quiz to be taken without access to the Internet. These fact-based effects are depen- dent on the reliability and the familiarity of the search engine, suggesting the processes by which the Internet affects cognition function differently across types of knowledge.

Źródło: Fisher, M., Goddu, M. K., & Keil, F. C. (2015, March 30). Searching for Explanations: How the Internet Inflates Estimates of Internal Knowledge. Journal of Experimental Psychology: General

Wyrwane z kontekstu – Brokat

Parę lat temu zwiedzałem nowoczesną drukarnię.
– Zamówiliśmy badania – powiedziała pani dyrektor – z których wynika, że zasadniczo książki czytają już tylko dziewczynki między dziewiątym a trzynastym rokiem życia.
– I co państwo zrobią? – spytałem.
– Właśnie kupujemy maszynę do brokatu.

Źródło: Jak przestałem kochać design, Marcin Wicha, Karakter 2015 (ebook)

Ankieta – Profil specjalistów UX w Polsce 2013

Po raz kolejny, wspólnie z Asią Kwiatkowską przygotowaliśmy pytania, które będą podstawą do opracowania raportu Profil specjalisty User Experience w Polsce 2013.

Ankieta zawiera 26 pytań, a jej wypełnienie zajmuje około 15 minut. Udzielenie odpowiedzi na wszystkie postawione przez nas pytania jest nieobowiązkowe, dlatego pytania mozna po prostu pominąć. Adres do ankiety:

raport2013.hci.org.pl

http://fluidsurveys.com/s/chipolska-raport

Badanie jest realizowane w okresie od 5 do 30 września 2013 r. Wśród osób, które pozostawią swój adres e-mail rozlosujemy trzy bony na zakupy (o wartości 20$) w sewisie Amazon oraz drobne upominki.

Po wypełnieniu ankiety zachęcamy do pozostawienia adresu e-mail, na który prześlemy raport podsumowujący badanie. Adres e-maill nie jest powiązany z udzielanymi odpowiedziami.

Bardzo gorąco zapraszamy do udziału ;)

Wyrwane z kontekstu – How to simulate context of use in-lab

If you have a product or service where context of use directly impacts on the user experience, consider these top tips when simulating context of use in the lab:

  • Let users experience the whole experience – Don’t force users down one single path. Instead allow users to explore the entirety of a system or site, even if parts are less developed
  • Consider physical factors – think about the physical set up e.g. the height, distance, angle and physical restrictions of the device/interface that will be used
  • Consider sensory factors which may distract the user from the task at hand and think about which of these can be brought into the lab
  • Consider factors which may normally enhance an experience – for example offer drinks and snacks when testing something designed to be used by a group of friends on a Friday night.

Źródło How to simulate context of use in-lab, Nicole Harlow, Foolproof

Wyrwane z kontekstu – The benefits of digital by default

Digital by default services are more efficient and more convenient for users. Our initial testing comparing GOV.UK to the previous Directgov and Businesslink.gov.uk sites shows a more positive rating on both ease of use (93% compared with 75% before) and speed (80 seconds as opposed to 120 seconds to undertake comparable transactions).

Government will save money if demand for higher cost channels decreases. A 2012 SOCITM study across 120 local councils estimated that the cost of contact for face to face transactions averages £8.62, for phone £2.83, but for web only 15 pence. The Digital Efficiency Report found that the average cost of a central government digital transaction can be almost 20 times lower than the cost of telephone and 50 times lower than face to face.

Źródło: Government Digital Strategy, praca zbiorowa, UK Cabinet Office

Raport – Profil specjalisty user experience w Polsce

Z wielką przyjemnością informuję, że z okazji Światowego Dnia Użyteczności opublikowaliśmy (Joanna Kwiatowska & Tomasz Skórski) raport Profil specjalistów user experience w Polsce. Miłej lektury.

Czym jest użyteczność? – Sonda uliczna

Organizatorzy WUD Silesia przeprowadzili bardzo interesującą sondę uliczną, zadając pytanie: “Czym jest użyteczność?”.  Polecam (czas trwania: 1 minuta 20 sekund).

Grafika – Six archetypes of Chineese knowledge workers

Źródło: Five Lessons Learned Doing User Research in Asia, Carissa Carter, UX Mag

Wyrwane z kontekstu – PICTIVE

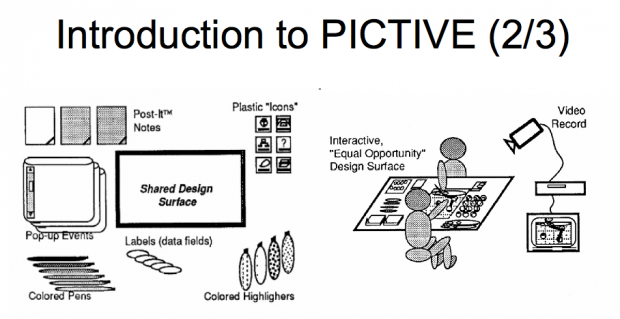
PICTIVE  to skrót od  Plastic interface for Collaborative Technology Initiatives through video exploration. Interesująca metoda wspólnego projektowania (participative design) opierająca się na wykorzystaniu prostych, podstawowych elementów wyposażenia biurowego, do projektowania interfejsów – bez wykorzystania technologii (za wyjątkiem kamery).

The PICTIVE object model consists of  common office objects, such as colored  pens and Post-It™ notes, as well as scissors and removable tape for tailoring  those materials. These low-tech objects are intended to be mapped onto com- puter functionality, usually as user interface objects. The materials may be supplemented with customized objects, such as proposed icons, or paper repre sentatlons of components of a windowing environment.

Zapoczątkowana metoda pochodzi z początku lat 90-tych (!) kiedy  użyteczność ciągle nazywana była human factors, graficzne środowiska wyglądały dramatycznie źle, a większość czytelników tego serwisu (włącznie z autorem) odbywała edukację w szkole podstawowej.

Under the PICTIVE process model,  these low-tech objects are used by all participants to express their ideas to one another. Each participant is responsible for explaining her or his personal and/or professional stake on the design, and for explaining her or his special expertise.  This may take the form of a mini-tutorial, or a demonstration of a prototype that  was developed following earlier sessions.

Usually guided by the users’ narrative of  their task flow, the group then uses the  low-tech objects to brainstorm ways of adapting technology to the users’ work process; these discussions may also lead to changes in the work process itself, with or without technology interventions. Often, diverse domains and perspectives are communicated through the concrete, low-tech artifacts. Each session concludes with a short design walk-through, captured on video. This helps to focus the group’s achievements, building mutual commitment and collective competence. It also provides a video “minutes of the meeting” that can communicate the group’s design to developers or to other groups (e.g., when multiple stakeholder groups are geographically separated).

The PICTIVE participation model contains three convergent guidelines for deciding who participates in a PICTIVE session. First, diverse expertise contributes unique knowledge to the design. Second, all phases of the software life cycle are likely to be facilitated by the enfranchisement and co-ownership of people who are “downstream” from the design process. Third, we follow the democratic concept that people whose work lives will be influenced by a design should participate In decisions about that design adapted for our North American corporate culture.

Źródła:

Wyrwane z kontekstu – Beyond Wireframing: The Real-Life UX Design Process

Marcin Treder, CEO UXPin opublikował w Smashing Magazine dość interesujący artykuł Beyond Wireframing: The Real-Life UX Design Process w którym prezentuje swoje wnioski z wywiadów z projektantami w kontekście podejścia  User Centred Design.

Poza dogłębną krytyką klasycznego podejścia, które do niedawna promowała między innymi U(X)PA, najważniejszy z tego tekstu jest według mnie poniższy cytat:

The four points mentioned above (collecting information about the problem, getting ready to design, design, approval – dop. ts) form a pattern visible in the majority of design processes that we went through with our interlocutors. You might have noticed that not a lot of iterative research is done in these processes. Sadly, the classic usability study is not a permanent part of the process. Why? The answer is simple: budgets are tight. Problems that appeared in the company that I used to work for appeared to be common. Tight budgets are forcing UX designers to tailor their processes and skip costly research.

I believe the best answer to this problem is guerrilla research methods. Startups do adapt guerrilla research as a part of the customer development process, but more “mature” companies, in my opinion, are strangely afraid of spontaneous and methodologically questionable yet efficient and cheap research methods.

Kusi mnie zostanie adwokatem diabła i postawienie jednak innego pytania: czy faktycznie użycie guerilla reaseach methods (uproszczonych badań?) przez niespecjalistów jest będzie prowadziło do dostarczenia produktów o jakiejkolwiek wartości? Nie raz i nie dwa słyszałem dumne: badamy użyteczność naszego produktu dla dramatycznie złych produktów. Wielokrotnie słyszałem o wycofowaniu się z badań z użytkownikami w procesie tworzenia oprogramowania, bo  ” badania nic nie wykryły” lub “nie niosły żadnej wartości“.

Jakiś czas temu czytałem drugą książkę Steve Kruga  Rocket Surgery Made Easy: The Do-It-Yourself Guide to Finding and Fixing Usability Problems i mam z tyłu głowy, że “takie badania mają sens i wykryją najbardziej oczywiste i uciążliwe problemy”. Jednak rzeczywistość – zarówno w tych małych startupach, jak i wielkich, dojrzałych organizacjach potrafi być inna – źle przeprowadzone badania (szczególnie przez osoby, którym wydaje się, że po przeczytaniu jednej książki są ekspertami od użyteczności) potrafią pogrzebać jakikolwiek związany z user experience (i usability) na bardzo bardzo długo. (tak to jest, jak się nieuważnie czyta artykuły)

Źródło: Beyond Wireframing: The Real-Life UX Design Process, Marcin Treder, Smashing Magazine

Jacy są projektanci w Polsce (i ile zarabiają?) – Zaproszenie do badania

Działające już od jakiegoś czasu stowarzyszenie CHI Polska wzorem większych organizacji tego typu, planuje przebadać i stworzyć profil polskich specjalistów zajmujących się szeroko pojętym projektowaniem i użytecznością/HCI/UX, co umożliwi nam wszystkim na uzyskanie większej wiedzy o sobie.

Od dziś do 27 czerwca 2012 roku, pod adresem http://badanie.hci.org.pl dostępna będzie ankieta, której wypełnienienie przez was w znaczącym stopniu umożliwi osiągnięcie tego celu.

Wśród uczestników badania, którzy pozostawią swój adres e-mail zostaną rozlosowane trzy półroczne abonamenty UXPin i 20$ kupon podarunkowy do Amazona.