Raport użyteczności mobilnych aplikacji bankowych

Właśnie zauważyłem, że Janmedia Interactive, firma uznawana onegdaj za pioniera użyteczności w Polsce, wydała 29 marca 2012 roku, przy okazji konferencji Generation Mobile Raport użyteczności mobilnych aplikacji bankowych.

Wrażenie robi zakres – w  ramach badań (audytów eksperckich) zostało przebadanych 10 aplikacji różnych banków na systemy Android i iOS. Interesujący jest zaprezentowany poziom szczegółowości. Rozczarowuje dział Wskazówki dla projektantów interfejsów aplikacji mobilnych – jedna strona rekomendacji to trochę mało, przy tak bogatej istniejącej wiedzy i literaturze w tym temacie.

Niemniej jednak zachęcam do przejrzenia i wyrobienia sobie własnej opinii na jego temat.

Dokument [PDF, 13 MB] jest do pobrania z mobilnego blogu jestem.mobi lub lokalnie.

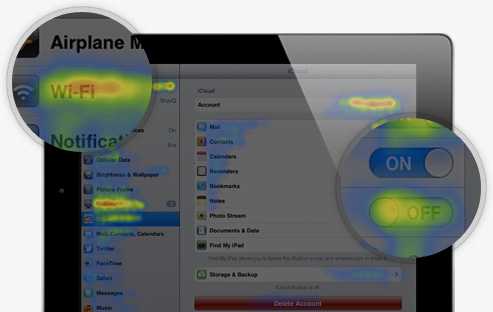
Heatma.ps – interesujący produkt z Polski dla mobilnych produktów Apple

Source: https://heatma.ps/

Heatma.ps jest dla iPhone-a i iPada tym, czym Crazyegg jest dla aplikacji webowych. Niewielkie SDK dołączane do bibliotek budowanej aplikacji, umożliwia uzyskanie interesujących informacji, jakich elementów na ekranie dotykają użytkownicy.

Model biznesowy opiera się na opłatach za określoną pulę UIElementów – w pakiecie darmowym można obserwować jeden element, każdy kolejny kosztuje około 10 dolarów (za 10000 sesji).

Jak działa aplikacja można zobaczyć na filmie poniżej.

 Autorem tego produktu jest polska firma SharQ, co samo w sobie jest świetną informacją, bo jakoś nie spodziewałem się innowacyjnego produktu na urządzenia mobilne z Polski. Nie czuję się także ekspertem w segmencie aplikacji mobilnych, ale czytelnicy MyApple sugerowali, że niniejsza aplikacja jest pierwszym produktem na iOS który umożliwia używanie heatmap. Tak więc – gratulacje!

PS.  Nie jest dla mnie do końca jasne, czy jako “element” jest liczony jeden “ekran” czy jeden “obiekt” na danym ekranie (przycisk, tabelka, grafika). Adam Hościło z TwistedLogic z którym konsultowałem ten tekst wskazywał że chodzi o jeden pojedyńczy obiekt.

Wyrwane z kontekstu – The Truth About Webcam Eye Tracking

Przeglądając różne blogi branżowe natrafiam od kilku miesięcy na temat webcam eye trackingu. Koncepcja ta  opierająca się na wykorzystaniu zwykłych, istniejących w laptopach kamerek (webcam) do badań eyetrackingowych, na początku 2012 roku brzmi lekko absurdalnie. Ale być może za kilka lat, wraz z rozwojem technologii i spadkiem cen, może się rozwinie?

Aga Bojko, autorka mającej się ukazać w tym roku nakładem wydawnictwa Rosenfeld Media książki Eye Tracking the  User Experience: A practical guide , popełniła bardzo interesujący wpis The Truth About Webcam Eye Tracking, w którym opisuje jak obecnie wygląda przeprowadzenie takiego badania i jakie są ich aktualne ograniczenia. Najważniejsze wnioski to:

  • What decreases the accuracy of webcam eye tracking even further is when participants move their heads, and the longer the session, the more likely this will happen. Therefore, webcam eye tracking sessions have to be very short – typically less than 5 minutes, but ideally less than a minute. Studies conducted with real eye trackers, on the other hand, can last a lot longer with little impact on accuracy.
  • Currently, webcam eye tracking can handle only single static pages. All four studies I have participated in and a few I read about were one-page studies. Without allowing participants to click on anything and go to another page, the applicability of webcam eye tracking is limited. This constraint also lowers the external validity of the studies.
  • The rate at which the gaze location is sampled is much lower for webcams than real eye trackers. The typical frame rate of a remote (i.e., non-wearable) eye tracker is between 60 and 500 Hz (i.e., images per second). The webcam frame rate is somewhere between 5 and 30 Hz. The low frame rate makes analyzing fixations and saccades impossible. The analysis is limited to looking at rough gaze points.
  • Due to imperfect lighting conditions, poor webcams, on-screen distractions, participants’ head movement, and overall lower tracking robustness, out of every 10 people who participate in a study, only 3 – 7 will provide sufficiently useful data. While this may not be a problem in and of itself because of very low oversampling costs, what makes me uncomfortable is not knowing how the determination to exclude data from the analysis is made. Data cleansing is important in any study but it is absolutely critical in webcam eye tracking. Exclusion criteria should be made explicit for webcam eye tracking to gain trust among researchers.

Źródło: The Truth About Webcam Eye Tracking, Aga Bojko, Rosenfeld Media Eye Tracking blog

Wyrwane z kontekstu – Facebook Sharing and Caring

What types of information are being shared?
The majority of respondents reported sharing several different types of information through Facebook (see Figure 2). Most commonly, respondents shared videos (70%), photos (67%), fun/humor (66%), music (60%), hobbies (57%), news articles (57%), or general information (57%). Of those respondents, fewer (34% – 47%) reported sharing school/research information, local information, or sports. Less than a third of respondents reported sharing products, books, or recipes.

Source: http://www.surl.org/usabilitynews/132/sharing.asp

Sharing Settings
Respondents were asked about their default sharing settings and how often they customized posts when sharing links. The majority of respondents reported their default sharing settings for posting updates was set to “Friends Only” (58%). Relatively few respondents used customized settings as their default group (8%). When respondents were asked how often they do customize sharing, the majority stated they do not customize, but instead use their default sharing settings (56%). Approximately 25% of respondents customized some posts, while more frequent customization, half of their postings or greater, occurred less often (> 20%).

Source: http://www.surl.org/usabilitynews/132/sharing.asp

Źródło: Facebook Sharing and Caring, Justin W. Owens, Usabilty News, December 2011, Vol. 13 Issue 2, USA

Wyrwane z kontekstu – The effect of the word “love”

In 14 bakeries we tested the effect of different messages associated with a fundraising solicitation. An opaque moneybox was placed near the cash register with a message explaining on a first line that the solicitation was for a humanitarian project for African children conducted by students. On the second line the words “DONATING = LOVING” (loving condition), “DONATING = HELPING” (helping condition), or no inscription (control) appeared. The second line was changed each day and for each bakery according to a random distribution. Results showed that more donations (almost two times more) were made in the loving condition compared to the two others, whereas there was no difference between the helping and the control conditions.

Źródło: The effect of the word ‘‘love’’ on compliance to a request for humanitarian aid: An evaluation in a field setting, Nicolas Gueguen and Lubomir Lamy, SOCIAL INFLUENCE 2011, 6 (4), 249–258, Psycology Press

Zarobki specjalistów użyteczności (głównie) z USA

Najświeższy, tegoroczny raport (dostęp ograniczony) Usability Professionals’ Association opracowany na podstawie ankiety przeprowadzonej na grupie powyżej 1000 respondentów, przynosi optymistyczne informacje odnośnie zarobków specjalistów do spraw użyteczności (głównie – bo ok. 70% badanych) w Stanach Zjednoczonych.

Wg badania, średnia roczna pensja to $92.899 (w tym odpowiednio $90.861 dla kobiet i $94.972 dla mężczyzn) i znacząco wzrosła  w stosunku do roku 2009  – kiedy ostatnio było przeprowadzane badanie – z kwoty $85.247.

Najmniej, zarabiąją oczywiście osoby praktycznie bez doświadczenia ($56.000),  praktycy posiadający od 5-7 lat pracy w zawodzie otrzymują rocznie $81.000, a przy doświadczeniu dłuższym niż 21 lat, zarobki wynoszą powyżej $132.000 rocznie.

Źródło: UPA International 2011 Salary Survey, Usability Professionals’ Association, 15 August 2011

Wyrwane z kontekstu – Do users change their settings?

We embarked on a little experiment. We asked a ton of people to send us their settings file for Microsoft Word. At the time, MS Word stored all the settings in a file named something like config.ini, so we asked people to locate that file on their hard disk and email it to us. Several hundred folks did just that.

We then wrote a program to analyze the files, counting up how many people had changed the 150+ settings in the applications and which settings they had changed.

What we found was really interesting. Less than 5% of the users we surveyed had changed any settings at all. More than 95% had kept the settings in the exact configuration that the program installed in.

Źródło: Do users change their settings?, Jared Spool, UIE Brain Sparks.

Wyrwane z kontekstu – Purchase Acceleration, Illusionary Goal Progress, and Customer Retention

Ran Kivetz, Oleg Urminsky i  Yuhuang Zheng opisali w 2006 roku badanie, którego celem było zbadanie skuteczności “iluzji postępu” (illusion of progress). W ramach eksperymentu, 108 klientom kawiarni wręczono karty lojalnościowe, które umożliwiały otrzymanie darmowej kawy/wypieku po zebraniu 10 pieczątek. Badani otrzymali dwa typy kart: z 10 polami do wypełnienia oraz z 12 polami, gdzie dwa pierwsze pola zostały już wypełnione. Klienci, którzy otrzymali kupony z 10 polami, zbierali średnio pieczątki  po  16 dniach, a ci którzy dostali 12 polowe kupony – średnio po 13 dniach, czyli zdecydowanie szybciej.

Method. The participants were 108 customers of the café we described previously. They were randomly assigned to either a control condition or an experimental (illusionary goal progress) condition. Specifically, research assistants posing as café employees randomly offered customers either a 10-stamp or a 12-stamp coffee card (…). The 10-stamp and the 12-stamp cards indicated that members were required to accumulate 10 and 12 coffee purchases, respectively, to earn one free coffee. However, customers assigned to the 12-stamp experimental condition received two preexisting bonus stamps, described as an offer to anyone who opted to join the program. Thus, although the two groups faced identical effort requirements when joining the program (i.e., r – nt = accumulating 10 coffee purchases), the experimental group started with a lower proportion of original distance remaining to the goal than did the control group (i.e., dt+2 = .83 and dt = 1.0, respectively). All other aspects of the program were held constant across the two conditions and were identical to those we described previously for the café RP.

Results. Consistent with H2, the results indicate that illusionary goal progress led to faster completion of the reward requirement. On average, customers in the control condition completed the ten required purchases (for the 10-stamp card) in 15.6 days. In contrast, customers in the experimental (illusionary goal progress) condition completed the ten required purchases (for the corresponding 12-stamp card) in only 12.7 days, nearly three days or 20% faster (t = 2.0, p < .05; medians = 15 versus 10 days; Z = 2.1, p < .05 [Mann–Whitney U test]).

Źródło: The Goal-Gradient Hypothesis Resurrected: Purchase Acceleration, Illusionary Goal Progress, and Customer Retention, Ran Kivetz, Oleg Urminsky,  Yuhuang Zheng  Journal of Marketing Research, Vol. XLIII (February 2006), 39–58, American Marketing Association

Stawki agencji interaktywnych w Wielkiej Brytanii 2011

Brytyjska agencja Econsultancy, w przeprowadzonej na przełomie czerwca i lipca 2011 roku ankiecie zapytała 364 agencje interaktywne (digital agencies) o ich stawki za 8 godzinny dzień pracy. Czy to na skutek kryzysu, czy też większego zainteresowania użytecznością, projektowaniem interakcji i dostępnością – średnie stawki na tych stanowiskach są niższe niż trzy lata temu w tym samym badaniu.

Average daily rates by category of job role, Source: Econsultancy

W przypadku projektów wartych powyżej 5 milionów funtów, stawki są znacząco wyższe i rozpoczynają się od 750 funtów.

Charge-out rates – Content, Usability and Accessibility roles, Source: Econsultancy

Źródło: Digital Agency Rate Card Survey 2011, Econsultancy, London, United Kingdom 2011

Wyrwane z kontekstu – Act First, Do the Research Later

W sierpniowym numerze Core77, Don Norman, autor m.in. kultowego Design of Everyday Things, współzałożyciel Norman Nielsen Group opublikował esej, który ma szansę stać się w przyszłości (niestety) jednym z najbardziej popularnych uzsadanień/wymówek do niewykonywania badań przed etapem projektowania:

Here are five very different arguments to support the practical reality of starting by designing, not through design research. First, the existence of good design that was not preceded by research. Second, the argument that experienced designers already have acquired the knowledge that would come from research. Third, the research effort of a company ought to be continually ongoing, so that results are available instantly. Fourth, and most controversial, research might inhibit creativity. And fifth, when the product is launched and the team assembled, it is already too late.
(…)
When I was a professor of cognitive science, I learned that reading and becoming expert at the existing research literature created a delicate tradeoff. Too much knowledge could be harmful. The point of my students’ PhD dissertations (and of all my own research) is to make a significant advance in the understanding of a topic. Read too much of the existing literature about what previous researchers have thought and done and you will follow in their footsteps. This means that you will also encounter the same dead ends. Without knowing the literature, you can be creative and often discover valuable new insights and directions.

Źródło: Act First, Do the Research Later, Don Norman, Core77

Wyrwane z kontekstu – Different Ways of Approaching Service Design

This review identifies that two areas in which we might expect to find research on service design – within design literature and within services literature – have not produced a developed body of knowledge. Rather, what emerges are two important tensions. The first is between understanding design either as problem-solving that aims to realize what has already been conceived of, or as an exploratory enquiry involving constructing understanding about what is being designed, involving end users and others in creating meaning. The second is a tension between the view that the distinction between goods and services matters significantly, or that service is better understood as a fundamental activity with multiple actors within a value constellation. Figure 1 summarizes these perspectives.

Figure 1. Approaches to conceptualizing service design

The framework in Figure 1 has two axes: one concerns how service is understood, the other concerns the nature of design. Together, the quadrants propose distinct ways of understanding service design. In the top left quadrant, design is seen as problem-solving and the conventional distinction between goods and services is maintained, a view that underpins work in some management fields (…) This quadrant is labeled “engineering” as its focus is the design of new products and services that can be specified in advance using systematic procedures; services are one particular category of artefact to be designed. Below, design can be understood as an exploratory process of enquiry that can be applied to different kinds of artefact such as products or services and where the distinctions based in industrial manufacturing between types of designed things matter (…). Within this quadrant sit the conventional fields or sub-disciplines of design in the art or design school traditions, with their focus on particular kinds of artefact such as furniture design, interiors or interaction design. This quadrant is labeled “non-engineering design disciplines”.

The top right quadrant sees design as problem-solving, but views service as a fundamental process of exchange (…) influenced by the service-dominant logic (…). This quadrant is labeled “service engineering” since the emphasis is on service, but the underlying design tradition is engineering. Finally, the bottom right quadrant sees design as an exploratory enquiry, but does not make an important distinction between goods and services (e.g, Bate & Robert, 2007). This quadrant is labeled “designing for service” rather than designing services, echoing work by several practitioners and scholars in the use of the preposition “for” (cf Meroni & Sangiorgi, 2011; Kimbell & Seidel, 2008). As Manzini (2011) similarly argues, talking of designing for services rather than designing services recognizes that what is being designed is not an end result, but rather a platform for action with which diverse actors will engage over time. Designing for service, rather than designing services, points to the impossibility of being able to fully imagine, plan or define any complete design for a service since new kinds of value relation are instantiated by actors engaging within a service context. Designing for service remains always incomplete (cf Garud et al, 2008).

This framework makes explicit differences in how people think about design and service, shaping how service design can be understood. It helps illuminate the underlying concepts about design and service that practitioners bring to their work as they engage in service design.

Źródło: Kimbell, L. 2011 Aug 14. Designing for Service as One Way of Designing Services. International Journal of Design [Online] 5:2. Available: http://www.ijdesign.org/ojs/index.php/IJDesign/article/view/938/345

Grafika – Top Uses of Mobile Phones While In Physical Stores

Jakiś czas temu zastanawiałem się, czy jakąkolwiek rację bytu mają aplikacje na telefony komórkowe, porównujące ceny produktów online – takie jak Amazon, Ceneo czy SaveUp. Nie jestem częstym gościem wielkopowierzchniowych sklepów, więc omijają mnie popularne zachowania klientów, a nie do końca wierzyłem w popularność rozwiązań tego typu.

Opublikowany w czerwcu 2011, sponsorowany raport e-tailing group przeprowadzony online na grupie 1.004 dorosłych (w USA), informuje o przynajmniej jednym interesującym trendzie: Przeszło 1/3 badanych sprawdza, będąc w sklepie ceny produktów online (w Amazonie i poza nim).

Source: The 2011 Social Shopping Study, e-tailing group, with sponsorship from PowerReviews

36 procent -to  wygląda imponująco. Pytanie tylko, kiedy w Polsceo siągniemy taką dojrzałość rynku, zarówno pod kątem dostępnych online produktów (i sprzedawców) jak i kupujących. Chociaż – wg bardzo niedokładnych danych z Android Marketu – aplikacja Ceneo miała pomiędzy 10.000 a 50.000 pobrań w ciągu ostatnich 30 dni. Szokująco dużo.

Źródło: The 2011 Social Shopping Study, e-tailing group and PowerReviews, USA 2011