Grafika – UX Framework

The outer circle distinguishes general phases in the (non-linear) process of sense-making, resulting in user experiences. The three user experience aspects in the center may lead to emotions/feelings and can be related to how specific design elements are experienced

Źródło: Conceptualizing and Measuring User eXperience, Joke Kort, Arnold P. O. S. Vermeeren, Jenneke E. Fokker, Towards a UX Manifesto, COST294-MAUSE affiliated workshop

Grafika – Logo

Źródło: wpis na fan page Junior Brand Manager, Facebook

Grafika – Just-in-time Information through Mobile

Źródło: Just-in-time Information through Mobile Connections (PDF), Lee Rainie, Susannah Fox, Pew Internet Project

Grafika – Framework for Visual Aesthetics

Źródło: A general framework for the study of visual aesthetics in HCI, Tractinsky, Noam (2012): Visual Aesthetics: in human-computer interaction and interaction design. In: Soegaard, Mads and Dam, Rikke Friis (eds.). “Encyclopedia of Human-Computer Interaction”. Aarhus, Denmark: The Interaction-Design.org Foundation

Grafika – The elements of user experience design

Źródło: Don’t believe the rumors: User Experience Design is alive and wellRian van der Merwe, Elezea

Grafika – Ad Dollars

Źródło: The Brads – Ad Dollars, Brad Colbow, Brad Colbow blog

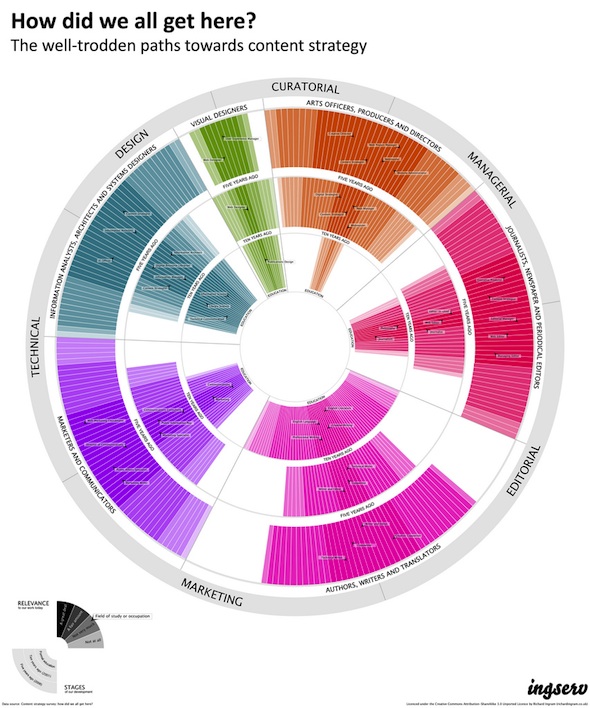
Grafika – How did we all get here?

Źródło: How did we all get here?, Richard Jingram

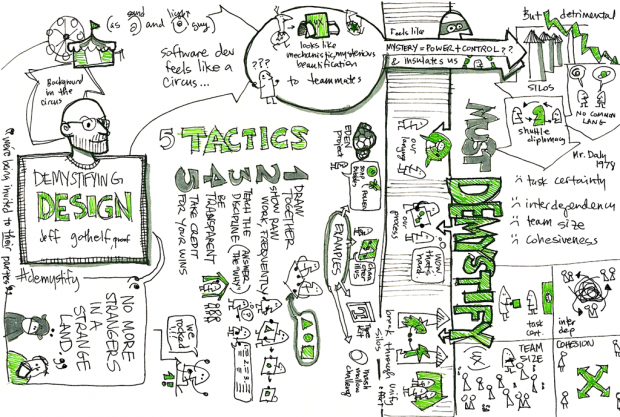
Grafika – Demystifing design

Źródło: Sketchnoting IxDA 2012, Chris Noessel, Cooper Journal

Grafika – Switch due to poor customer service

Companies are missing the chance to set the right expectations at the onset of the customer relationship. Industry-specific switching behavior remains considerable, especially in emerging markets. In aggregate, two in three consumers switched companies  in the past year in at least one of the  industries covered by the survey due to poor  customer service.

Źródło: Accenture 2011 Global Consumer Research Study (PDF), Accenture

Grafika – To the user, interface is a product

“To the user, the interface is the product” – Aza Raskin

Grafika – Why UX designers love documenting?

Bardzo ciekawa infografika autora Marcina Tredera (UXPin) pierwotnie umieszczona w prowadzonym przez niego serwisie uxaid.com. Marcin ostatnio umieścił kilka ciekawych infografik. Polecam, godne uwagi!

Grafika – Collaboration with Content Strategist

Źródło: Collaboration with Content Strategist, Richard Ingram