W ramach jednego z z poprzednich wpisów – “Magia numerów: Trzy kliknięcia i ani jednego więcej” przywoływałem (postrzeganą i zdiganozowaną jako fałszywą) regułę trzech kliknięć. Analizując historię tej metryki, zacząłem się zastanawiać na inną metodą mierzenia wydajności użytkownika w nawigacji – powiązanego z ilością odwiedzonych stron.
Z pomocą przyszło kilka źródeł i artykułów, z których najciekawszym jest artykuł “Towards a practical measure of hypertext usability” który ukazał się 15 lat temu (!) w znakomitym czasopiśmie Interacting for Computers. Artykuł opisuje w szczegółach badanie grupy 16-17 uczniów, przeszukujących strony uczelni pod kątem dni otwartych i egzaminów.
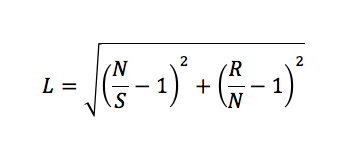
We wspomnianym artykule autorka zaproponowała współczynnik zagubienia na stronie (lostness), określony następującym wzorem:
gdzie:
- L: współczynnik zagubienia
- N: liczba różnych stron odwiedzonych podczas wykonywania zadania
- S: liczba wszystkich stron odwiedzonych podczas wykonywania zadania (wliczając ponowne odwiedziny tych samych stron)
- R: minimum stron potrzebnych do wykonania zadania
Przeprowadzone przez Pauline A. Smith badania wykazały, że wartością graniczną, dla której zaczyna się powyżej której pojawia się u badanych uczucie zagubienia, jest wartość 0,42. Aby jednak nie traktować tego wskaźnika, jako kolejnego z serii “magicznych numerów”, autorka dodaje:
It is not suggested that any of the measures proposed are definitive, rather that they could provide assistance for the implementors of hypertext systems in allowing them to practically and quickly identify and focus on areas of their information base where the users are exhibiting dysfunctional behaviour. It is suggested that they could be more useful for this purpose than the more traditional measures of tune taken to complete a task and the number of errors.
Warto też dodać, że samego współczynnika zagubienia nie można korelować z satysfakcją użytkownika (lub jej brakiem) bez przeprowadzenia i obserwowania dodatkowych wskaźników.
Bibliografia dla zainteresowanych:
- Towards a practical measure of hypertext usability, Pauline A. Smith, Interacting with Computers,Volume 8 Issue 4, December, 1996, 365-381 (dostęp ograniczony)
- Implicit measures of lostness and success in web navigation, Jacek Gwizdka and Ian Spence, Interacting with Computers, Volume 19, Issue 3, May 2007, 357-369
- Performance Metrics, Measuring the User Experience: Collecting, Analyzing, and Presenting Usability Metrics, Thomas Tullis and William Albert, Morgan Kaufmann, March 2008, 89-90


Recent Comments